Site map
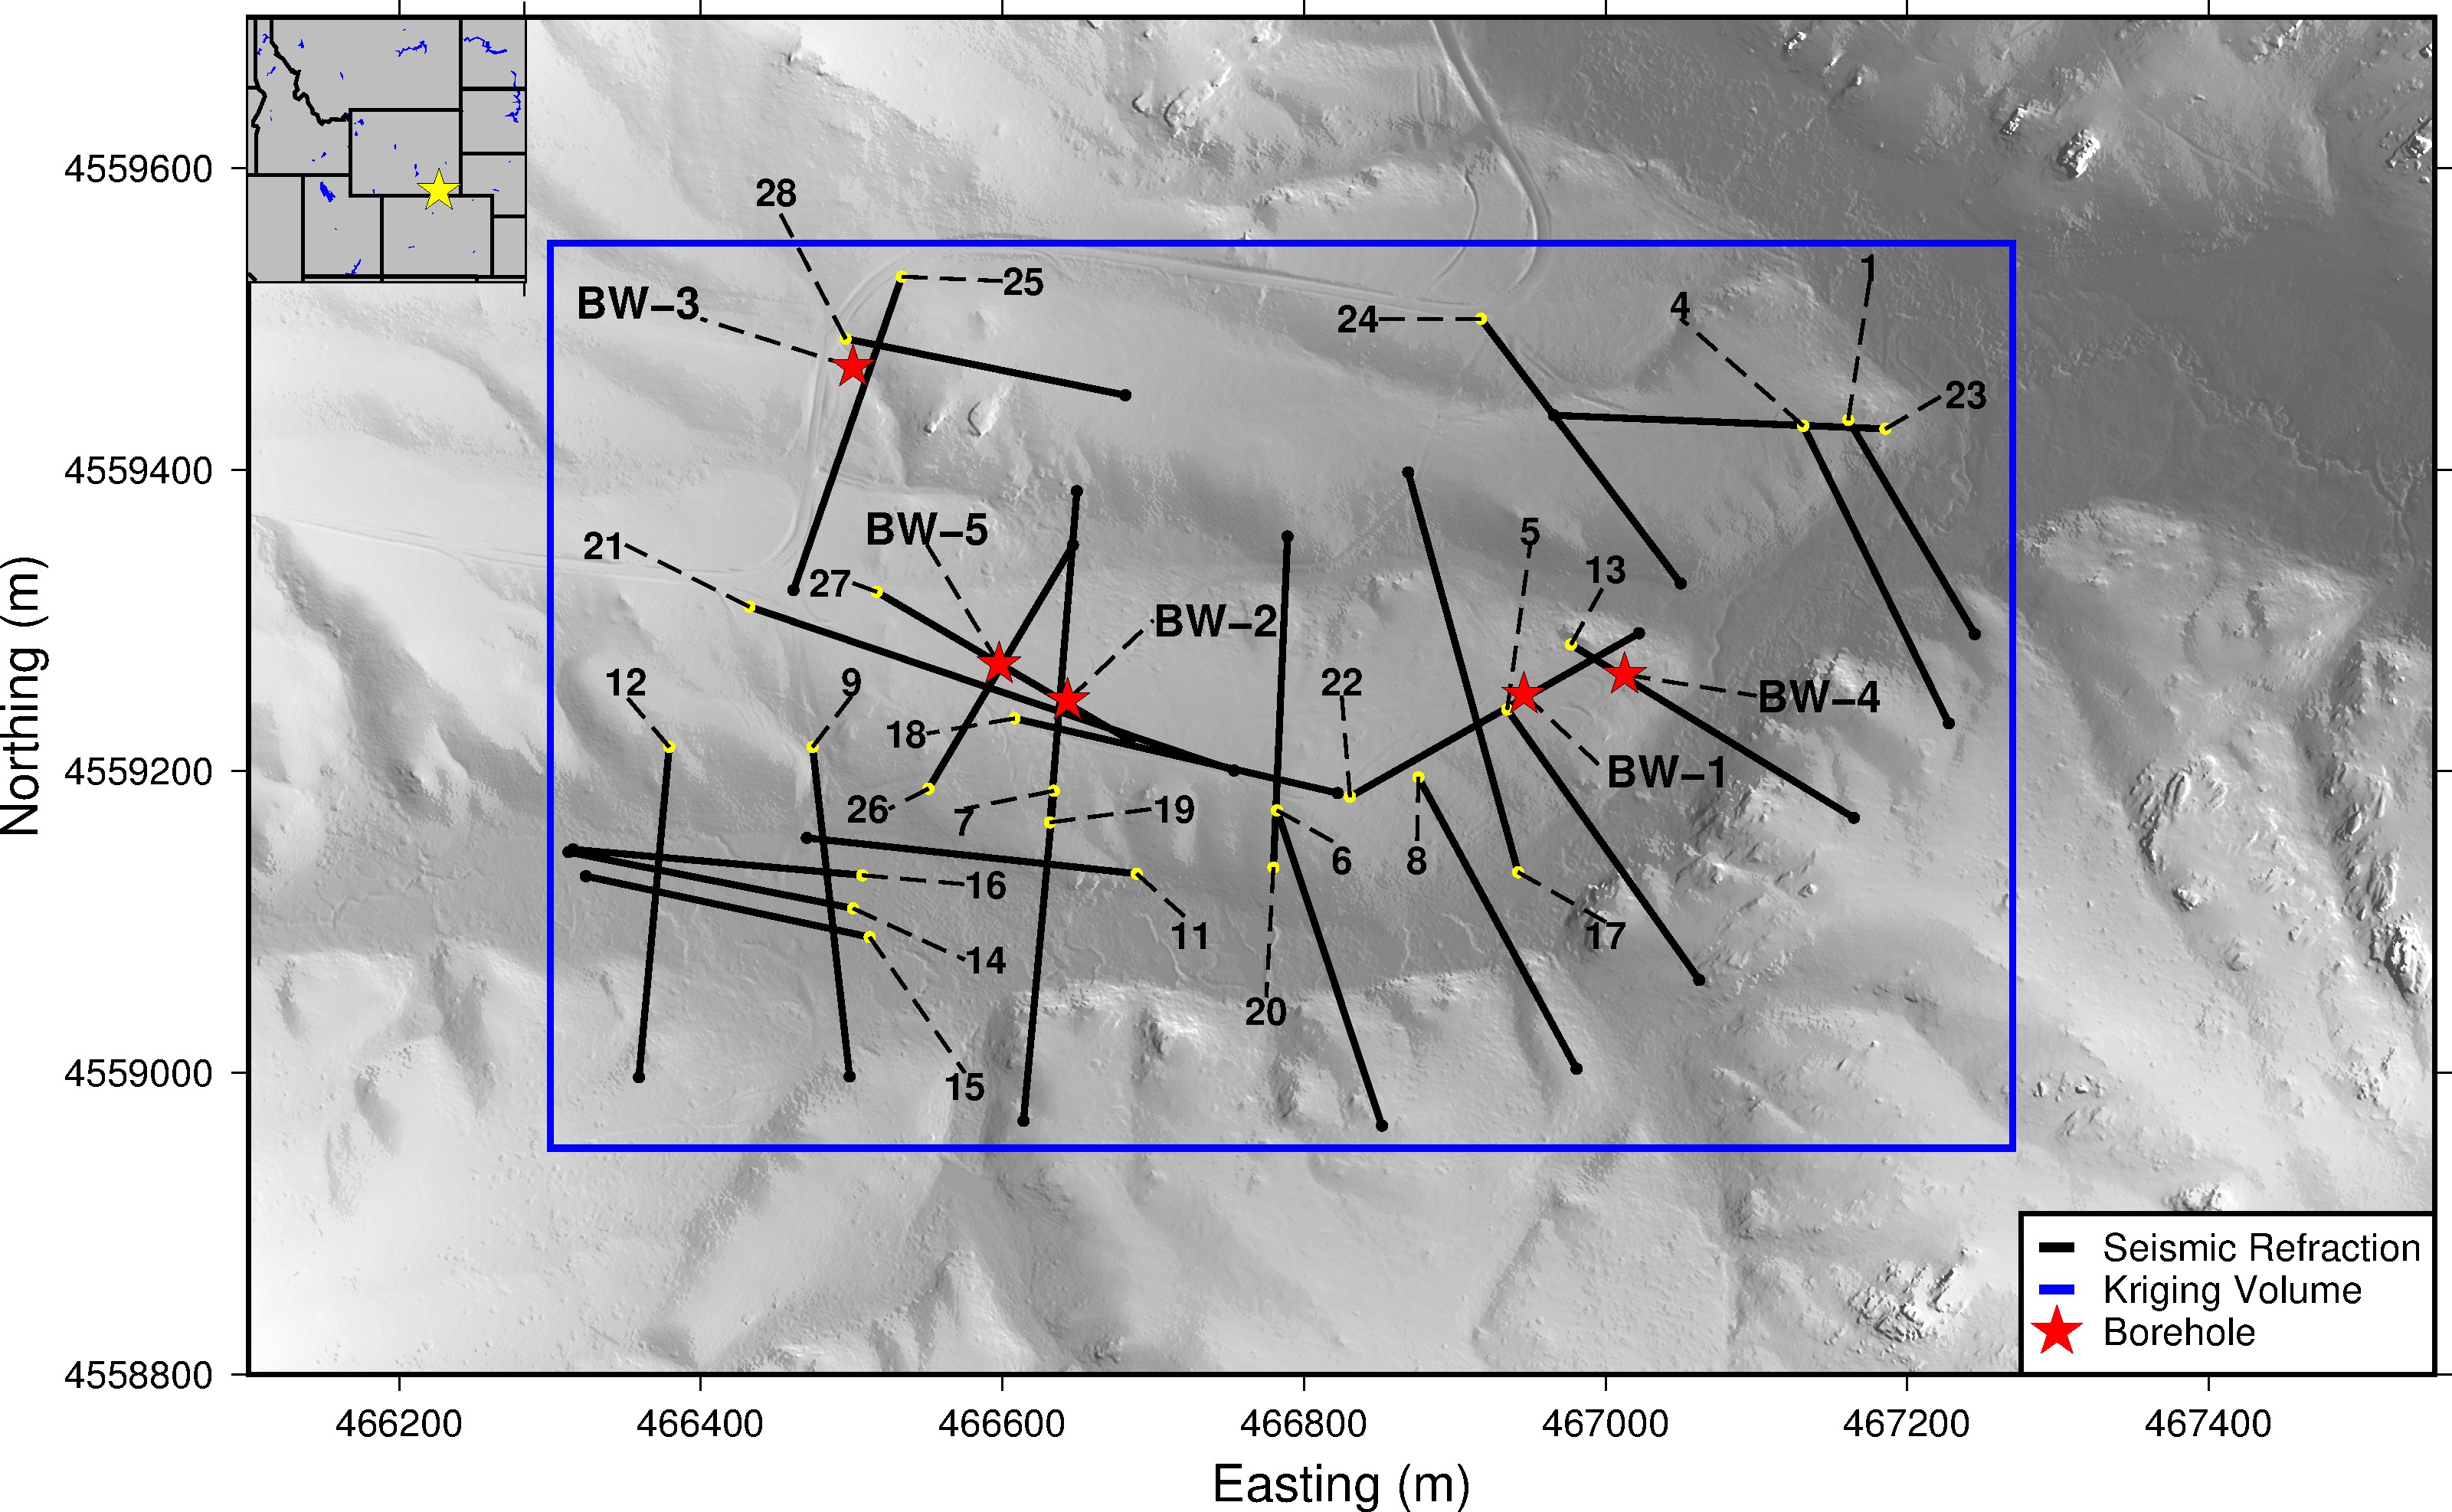
Map of my research site in the Laramie showing the seismic refraction transects on the light detecting and ranging (LiDAR) hillshade.
The zone of earth’s surface that extends from the top of vegetation to the depth where surface processes no longer chemically or physically alter the parent rock has been deemed the critical zone (CZ). Over geologic time scales, biological, chemical and physical processes transform rock into soil. The resulting CZ structure generated by these processes creates shallow groundwater aquifers, controls surface groundwater interactions, influences solute transport, and affects the timing and delivery of water to rivers and streams. Even though there is a CZ on almost every terrestrial surface, is spatially variable and hard to image. Conceptually, the CZ is broken down into regions defined by the chemical and physical state of the material or processes occurring in each regions. There is a lack of understanding about the vertical and horizontal extent of the CZ on landscape scales, if the transition between layers are gradational or sharp, or even which of these layers exist on any given landscape.
Insight about key physical and chemical processes and groundwater movement and storage can be gained with spatially exhaustive images of CZ structure. I have a unique geophysical data set that includes 25 individual 2D seismic refraction transects (~6 line km of data) and five boreholes with geophysical logs. The site is located in a high (~2500 m) mountain granite catchment. I am using this data set to provide new and images and link them to hypotheses that provide processes that might produce the resulting CZ structure, with emphasis on crystalline rock. The research goals include:
1. Can we image CZ structure in 3D using extensive 2D geophysical data sets?
2. Can we link the geophysical images to the physical and chemical state of the rock?
3. Can we identify active processes that shape and maintain CZ structure using near-surface geophysical data?
My first paper, which is in final stages of submitting, addresses these key questions. We image the CZ in 3D by interpolating the dense 2D profiles using geostatistics, specifically ordinary kriging. This yields a large, 970 by 600 by 80 m, volume of seismic velocities and corresponding kriging variance. We can then use the kriging variance to eliminate high areas of uncertainty in the interpolation. The profiles and volume that we generated are shown below:
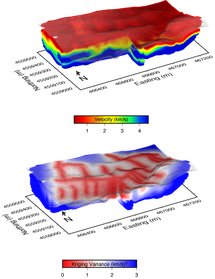
Left: Fence diagram of all 25 seismic refraction lines in my study area. Right. Slices through the 3D volume of seismic velocities (top) and kriging variance (bottom) generated with ordinary kriging. The kriging variances were used to remove the obvious stripe artifact in the lowest portion of the volume.
The critical step is interpreting the seismic velocity in terms of CZ structure. In short, we interpret fresh bedrock using a seismic refraction survey on outcrop, and by inspecting optical televiewer data from 5 boreholes within the region. To determine the depth of saprolite we rely on the depth of casing from drillers. The key lesson is that borehole information is critical to create images of bedrock topography and map the boundary separating saprolite and weathered rock. The bedrock map and boundary between saproltie and weathered rock is shown below:
Left: Bedrock topography of our study area. The bedrock surface was calculated by extracting the 4 km/s velocity contour from the kriging volume. The colors represent the depth to bedrock, which was calculated by subtracting the surface elevations from the bedrock elevations. Right: The boundary between the weathered bedrock and saprolite. This boundary was calculated using the 1.2 km/s velocity contour, and is supported by casing depths of 5 boreholes and optical televiwer data directly below casing. The colors represent the thickness of saprolite.
I explore the 3D CZ structure through the lens of conceptual models that propose mechanisms for the relationship between surface topography and the weathering front: the bedrock drainage model (Rempe and Dietrich, 2014), topographic stress model (St. Clair et al., 2015), and frost cracking model (Anderson et al., 2013). Each of these models focuses on a distinct process by which weathering and landscape evolution coevolve and provide 2D predictions of important CZ boundaries using topographic characteristics such as hillslope length, slope or aspect. Our results show that different CZ process based models should not necessarily be viewed as competing, but rather should be treated as complementary processes that may have distinct zones of influence in the critical zone.
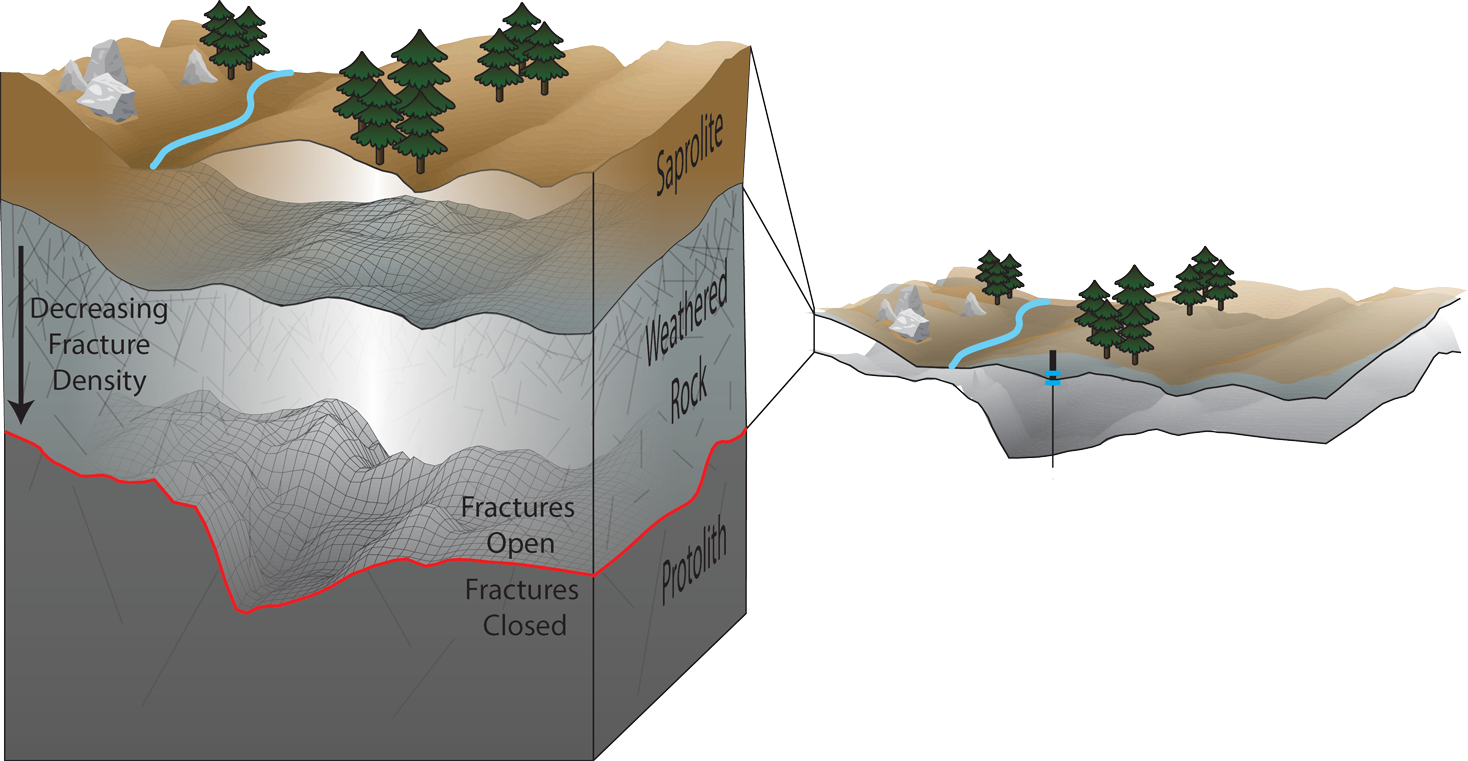
A conceptual model based on the 3D seismic volume. In the smaller inset, which is less vertically exaggerated, you can see the inverted bedrock topography and the convex downward weathered bedrock surface that occurs near to water table. In the larger vertically inset you can see the complexity on these surface because of the large data set we have. We interpret the red boundary as a boundary controlled by regional and topographic stresses closing fractures and interpret the saprolite/weathered rock boundary that is controlled by bedrock drainage processes.
Cited References:
Anderson, RS., Anderson, SP., Tucker, GE. 2013. Rock damage and regolith transport by frost: an example of climate modulation of the geomorphology of the critical zone. Earth Surface Processes and Landforms 38 : 299–316. doi:10.1002/esp.3330
Rempe, DM., Dietrich, WE. 2014. A bottom-up control on fresh-bedrock topography under landscapes. Proceedings of the National Academy of Sciences 111 : 6576–6581. DOI:10.1073/pnas.1404763111
St. Clair, JS., Moon, S., Holbrook, WS., Perron, JT., Riebe, CS., Martel, SJ., Carr, B., Harman, C., Singha, K., Richter, DdeB. 2015. Geophysical imaging reveals topographic stress control of bedrock weathering. Science 350 : 534–538. DOI:10.1126/science.aab2210