I took introduction to geostatistics in the fall of 2013. This was an excellent introduction course to basic geostatistical methods. These methods is how we can correlate data sets spatially and with each other. After taking this course I have a much better understanding of how kriging images are constructed. Understanding the details that build these interpolations is very important when interpreting interpolated data. Kriging methods are used a lot in the hydrologic community and other research fields. As a result of this class I have a much better understanding of these papers. I am hoping to incorporate geostatistical methods into my research to interpolate shear wave velocities constructed from surface wave dispersion curves across the geophysical line.
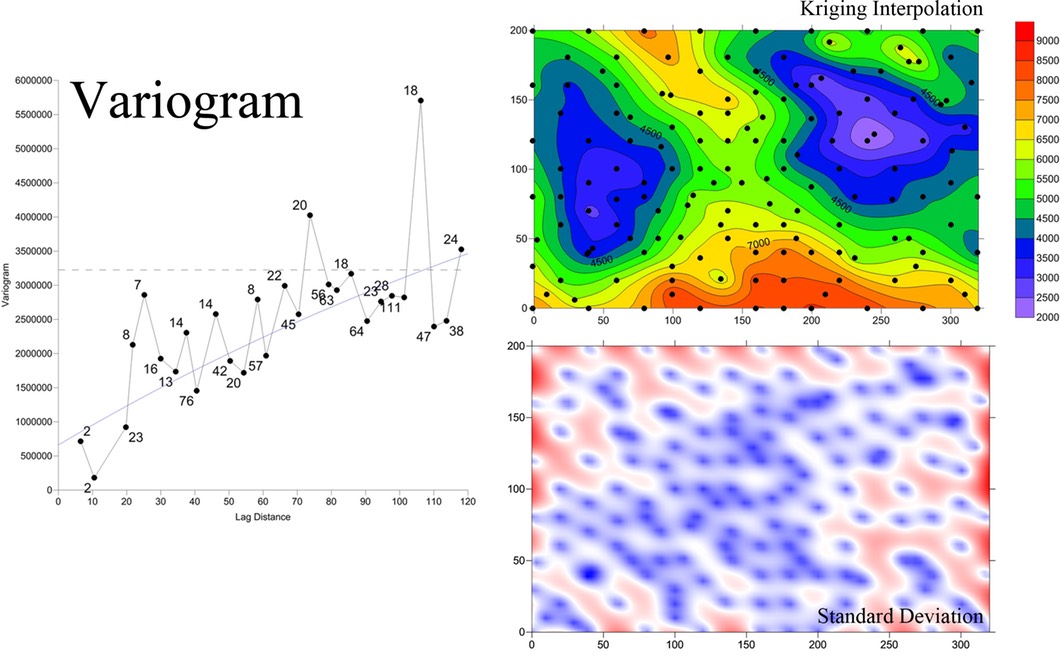
A raw variogram fitted with an exponential model and the resulting interpolated maps generated using the model. The top map shows the kriging estimate and the bottom map is the resulting standard deviation from the kriging values (blue is zero and red is high).