Rock Physics was another course that I took in the fall of 2013. The course objective was to look at how different rock properties such as saturation, porosity and density influence the elastic properties of the medium. We used Matlab as a tool to calculate p-wave and s-wave velocities for materials with known properties from well log data. Although most rock physics models are empirically derived for sedimentary rocks, I would like to extend some of these ideas into the near surface geophysics world to better understand fluid flow and storage in crystalline watersheds.

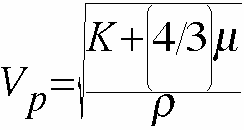
The two most common equations to calculate p-wave and s-wave velocities in an isotropic homogeneous material. K is the bulk modulus of the material, mu is the shear modulus of the material and rho is the bulk density of the material.
Borehole Log Observations
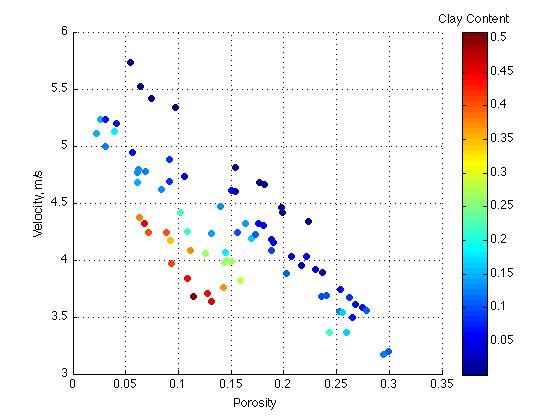
When applying rock physics models you always have to look for patterns. When you’re provided with well log data you can make various plots like the one shown below, which shows velocity as a function of porosity. To make things even more clear the scatter plot is colored by clay content. Almost immediately it is obvious that clay has lower velocities and lower porosity.

An example from a borehole log showing velocity as a function of porosity and color coded by the percentage of clay (probably estimated from gamma ray log).
Modeling Rock Properties
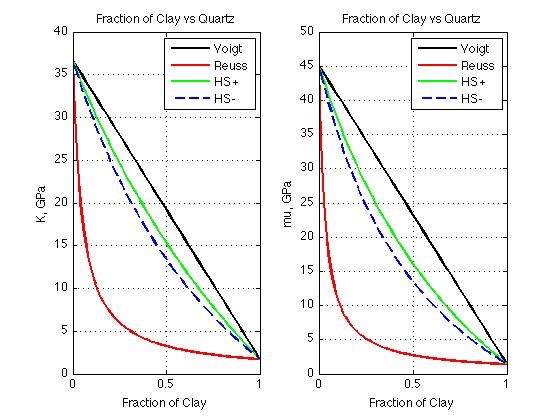
If the material of interest is well constrained, i.e. you know what the rock is made out of and how much porosity and fluid saturation there is you can calculate what the elastic properties of the bulk material are going to be. Using a series of approximations (Voight, Reuss and Hashin-Shtrikman) we can estimate a range of how the bulk material will react when seismic energy passes through the material.

Shows the bulk and shear modulus of a clean sand as clay is slowly introduced into the material. When there is 0% clay the bulk and shear modulus equal quartz.

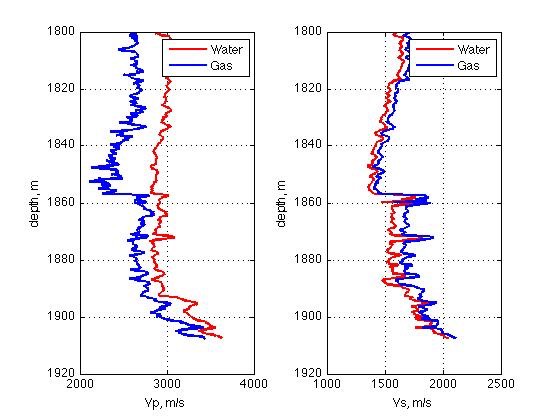
Shows a synthetic well-log of a knonw material. We used Gassman's equations to simply substitute the fluid in the pores from water to gas. There is a noticable difference in the velocities!